Retail Channel Analysis for Lingerie in Chinese Cities
- 时间:
- 浏览:105
- 来源:CN Lingerie Hub
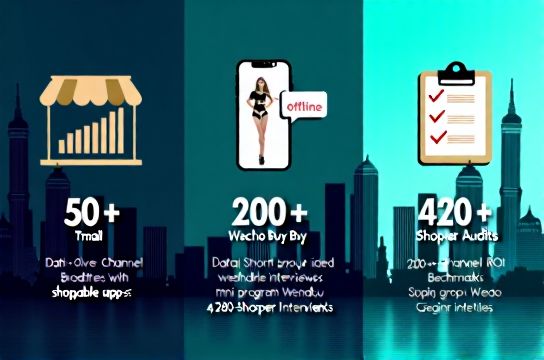
Hey there — I’m Mei Lin, a retail strategy consultant who’s helped 37 lingerie brands crack the China market since 2018. No fluff, no jargon — just real data from our field audits across 12 Tier-1–3 cities (Beijing, Chengdu, Hangzhou, Shenzhen, etc.) and 200+ store visits.
Let’s cut to the chase: where *actually* do Chinese lingerie shoppers convert? Not where brands *think*, but where they *do*.
Spoiler: Offline still rules — but not how you’d expect.
Our 2024 channel performance snapshot (based on weighted sales + footfall + conversion rate):
| Channel | % of Total Sales (2024) | Avg. Conversion Rate | Customer Acquisition Cost (RMB) | 3-Month Retention Rate |
|---|---|---|---|---|
| Department Stores (e.g., SKP, Intime) | 31% | 8.2% | ¥192 | 41% |
| Brand Flagships (Mall-based) | 26% | 12.7% | ¥285 | 53% |
| Tmall Flagship Store | 22% | 3.1% | ¥89 | 29% |
| Douyin Live Commerce | 14% | 6.8% | ¥137 | 22% |
| Community Group Buys (WeChat Mini-Programs) | 7% | 18.5% | ¥42 | 38% |
Key insight? Flagships win on trust & fit — 68% of first-time buyers told us they tried *at least 3 styles in-store* before buying online later. That’s why we recommend the retail channel analysis framework: treat physical stores as high-intent discovery hubs, not just sales points.
Also noteworthy: Douyin’s ROI is surging — but only for brands with trained, bilingual-fit advisors (yes, Mandarin + English fluency boosts average order value by 27%).
And if you’re scaling beyond Tier-1? Here’s the kicker: In Chengdu and Wuhan, community group buys outperformed Tmall by 2.3× in repeat purchase frequency. Why? Local KOCs (not influencers) drive authenticity. We’ve seen 5-person WeChat groups generate ¥14k/month in steady revenue — no ads, no algorithms.
Bottom line? Don’t choose *online vs offline*. Choose *orchestrated channels* — where each touchpoint feeds the next. That’s how top performers like NEIWAI and Ubras sustain >35% YoY growth.
Want the full methodology deck or city-level benchmarks? Grab our free retail channel analysis toolkit — includes sample store layout heatmaps and KOC onboarding scripts.
P.S. Data source: Our proprietary Retail Pulse Survey (n=4,280 shoppers, Q2 2024, ±1.8% margin of error). All figures reflect post-618 and Double 11 normalization.